
Fig. 7.
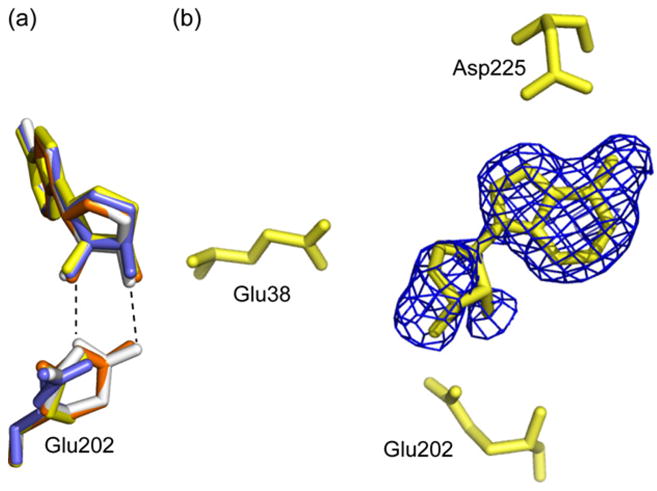
The AtMTAN1-SAH active site. (a) The catalytic residue, Glu202, is found in two conformations in the crystal structure of AtMTAN1 in complex with SAH. In monomers A and C, Glu202 is observed in the catalytic position at 40% occupancy. This orientation allows direct hydrogen-bond interactions with the substrate, which are essential for catalysis. The dominant conformation of Glu202 in all four monomers is too far for direct interaction with the ligand. Monomers A, B, C and D are illustrated in orange, yellow, white and blue, respectively. Hydrogen bonds are represented by dotted lines. (b) The experimental σA-weighted 3Fo − 2Fc electron density map, contoured at 0.8σ, superimposed over SAH in the refined structure. Adenine and SAH are each refined to 50% occupancy. The 5′-homocysteinyl substituent of SAH has not been modeled because no clear electron density was observed for this region. (For interpretation of the references to colour in this figure legend, the reader is referred to the web version of this article.)