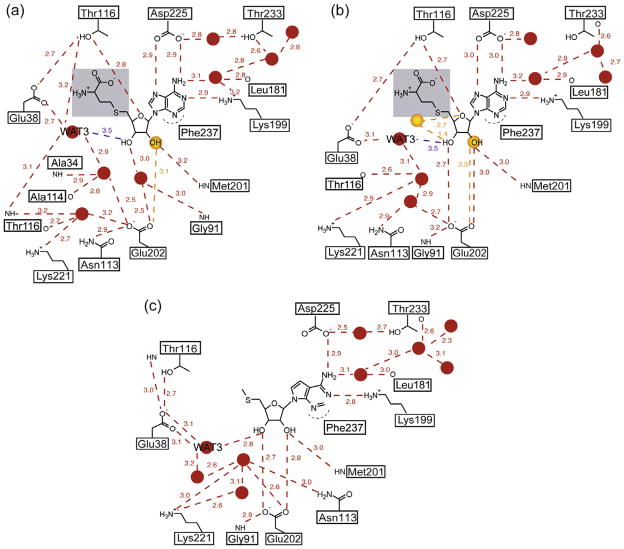
Fig. 8.
Schematic representation of the ligand-bound AtMTAN1 active sites. Ligand interactions in (a) monomers B and D, and the dominant state of monomers A and C of AtMTAN1-SAH, (b) the minor conformation of monomers A and C of AtMTAN1-SAH, and (c) the structure of AtMTAN1 in complex with the substrate-analogue, MTT (PDB: 2QTG). Hydrogen bonds are represented by dotted lines. Distances are expressed in angstroms and correspond to the average distances observed in all monomers. The distance between WAT3 and SAH exceeds our definition of 2.2–3.2 Å for a hydrogen bond, and is represented in purple. Water molecules are represented by red circles. Water molecules that are present at half occupancy are coloured in orange. Panel (c) was adapted from Siu et al. (2008a).

