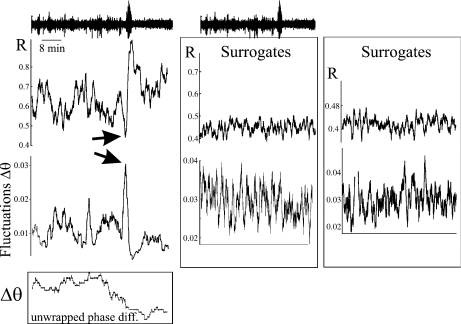
Fig. 1.
Growth of the fluctuations in phase difference between two intracerebral electrodes located in the left hippocampus of patient 1 suffering from temporal lobe epilepsy. Upper trace is the 54 min recording from one of the electrodes, with the seizure visible as the large amplitude signal located at minute 36 and lasting ∼55 s. The phase synchrony index R between the two signals is plotted (upper graph) for the duration of the recording: note the increase in R during the seizure and the drop immediately before the seizure, the latter coinciding with the growth of the fluctuations in phase difference (lower graph, evaluated at 30 ± 2 Hz) seen just before the seizure (arrows). Insetat the bottom shows the time evolution of the unwrapped phase difference between the two signals, exhibiting phase jumps and the relatively “flat” region coinciding with the seizure. Time scale (x-axes) is the same for all panels. Right-hand side graphs represent the same analysis done using phase-randomised surrogates of the two signals. Two examples are shown: note that the increase in synchrony at the time of the seizure disappears and that there is no absolute maximum of the fluctuations preceding an absolute maximum in R

