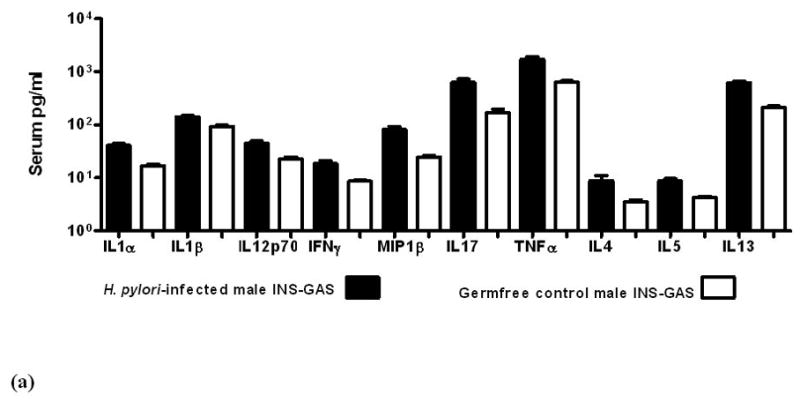
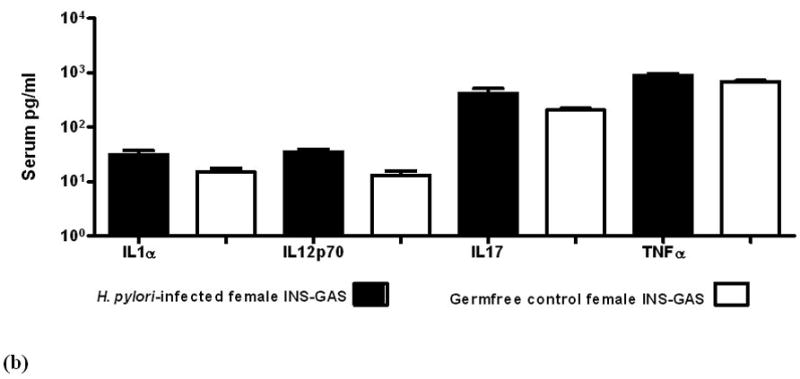
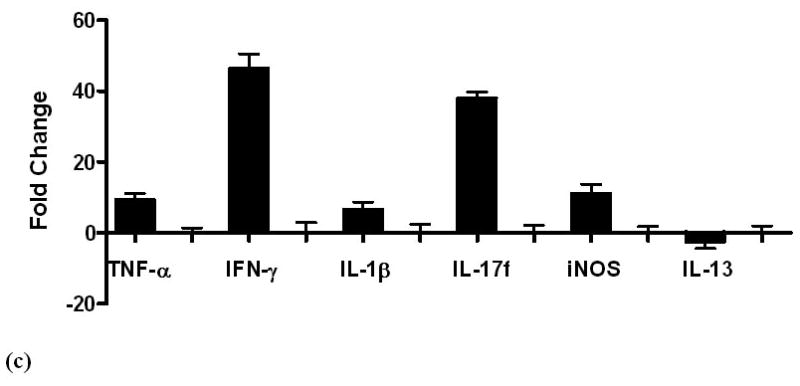
Figure 5.


Serum levels of cytokines and chemokines in GF control and H. pylori-monoassociated (a) male INS-GAS mice at 9 mpi and in (b) comparable groups of females at 11 mpi. Within each gender, all differences between infected and GF control mice were significant (males, p<0.02; females p<0.04). (c) Fold-change of mRNA expression levels in gastric tissue from H. pylori-monoassociated INS-GAS mice (gender data combined) at 9 mpi when gastric lesions were most severe. Fold-change represents comparison to baseline levels pre-set for gastric tissues from control GF mice. There were no gender differences (not shown) and all differences between expression levels of H. pylori-monoassociated and GF control mice were significant (p<0.01, all but IL-13; p<0.04 for IL-13). Error bars for panels (a), (b) and (c) represent standard deviation.
