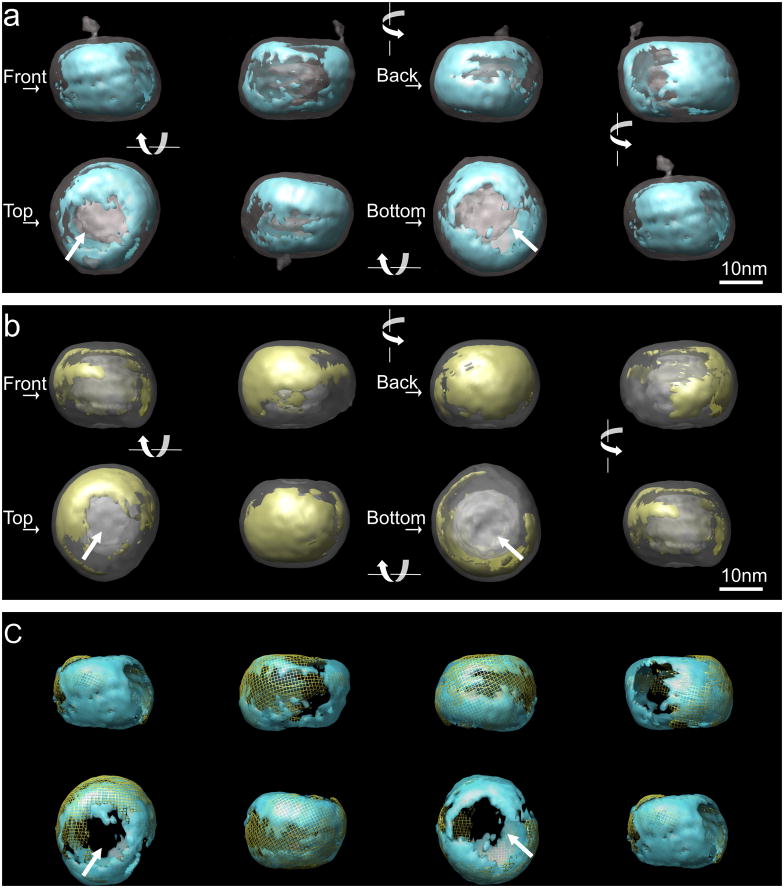
Figure 3. Density distribution at the surface of LDL and undecagold labeled LDL.
Two volumes were aligned with EMAN program. For the underlying transparent grey structure, the threshold in the voxel density histogram was chosen to display the overall shape (~0.8σ and ~1.4σ for unlabeled and labeled LDL respectively). The overlaid structure was turned 90 in each frame and displayed from left → right in the first row and right → left in the second row. The orientations of the structure are arbitrary defined and indicated as “front”, “back”, “top” and “bottom”. In the “top” and “bottom” views, the arrows indicate the low density regions at the flat surfaces. a. Iso-surface display of LDL structure (transparent gray) overlaid with the higher density regions. The threshold contour level (~4σ) was chosen to include a volume corresponding to the volume of apoB (blue). b. The iso-surface display for undecagold labeled LDL structure volume overlaid with the higher density regions (threshold ~4.6σ) from gold contribution determined as described in Methods (yellow). c. Overlay of the high density regions in the structures of the two volumes shown in a and b. The high density regions from the unlabeled LDL are in transparent blue and the high density regions from undecagold labeled LDL are in yellow mesh.

