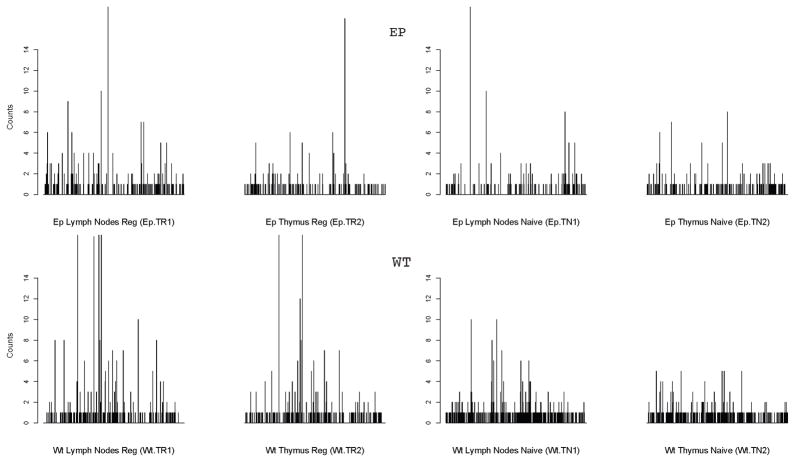
Figure 1. Marginal empirical counts for individual clonotypes in TCR-mini mice dataset.
The empirical frequencies for each TCR clonotype in eight repertoires are presented as bar plots, with each bar corresponds to the observed frequency (possibly zero) of a particular clone sequence observed in the respective population. The ordering of the clone sequences remains the same across all bar plots so as to allow for direct comparison. The maximal empirical count observed was 42, but for better readability, all the counts are truncated at 16.

