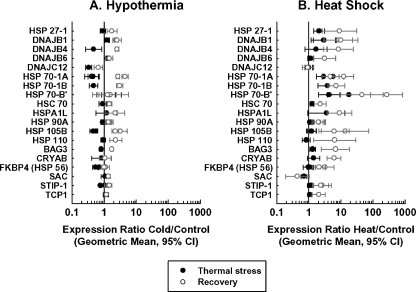
Fig. 4.
Effect of hypothermia and heat shock on the expression of selected HSPs, chaperonins, and co-chaperonins. For illustrative purposes, the sequences shown were significantly affected at one or more time points in the ANOVA analysis had a geometric mean expression ratio of twofold or greater (0.5 or less for decreased sequences) at one or more of the significant time point(s) and had at least one set of 95% confidence intervals that excluded unity. Some genes were represented by more than one sequence and thus have more than two data points per line

