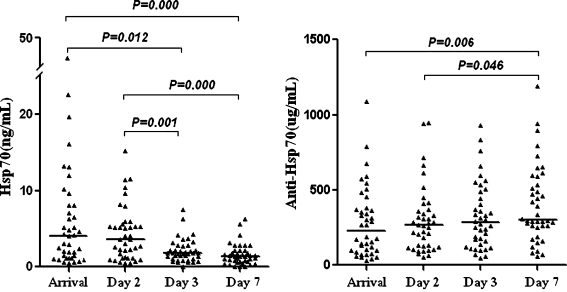
Fig. 1.
Hsp70 and anti-Hsp70 antibody levels at the different time points after AMI (n = 40). Individual and median levels (horizontal bars) are shown. The median (25th and 75th quartiles) levels of Hsp70 were 4.06 (1.23-8.09), 3.59 (1.16-5.54), 1.80 (1.05-2.77) and 1.40 (0.66-2.09) ng/mL, and anti-Hsp70 antibody were 225.81(96.72-376.01), 266.53 (121.40-366.32), 282.84 (143.49-477.99) and 299.65 (254.08-574.44) µg/mL at the four time points respectively. Log10 transformed Hsp70 and anti-Hsp70 antibody levels were compared over the time course using the repeated one-way ANOVA test (LSD)

