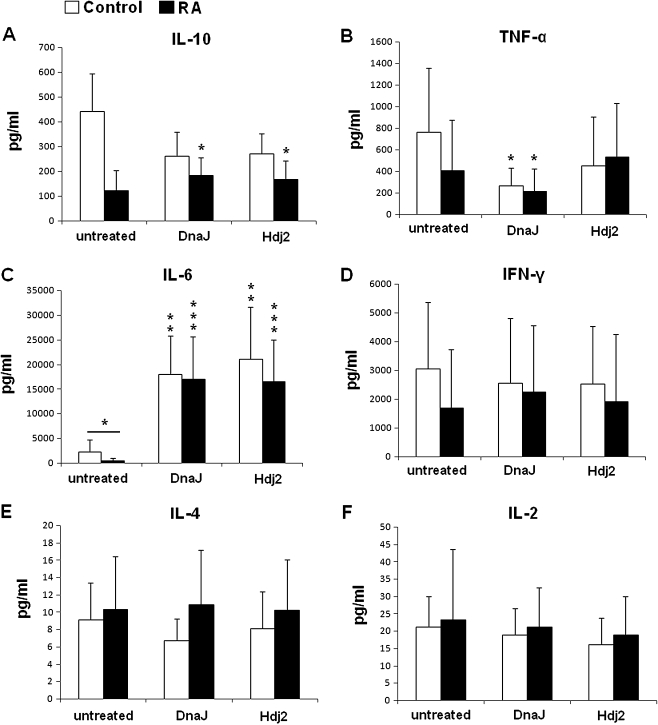
Fig. 4.
Evaluation of IL-6, IL-10, TNFα, IL-2, IL-4, and IFNγ secretion by PBMCs from patients with RA and healthy control. The results are presented as mean values (±SD). The PBMCs’ responses to Hsp40 antigens are compared to those of the untreated cells, unless otherwise indicated. *P ≤ 0.05; **P ≤ 0.01; ***P ≤ 0.001

