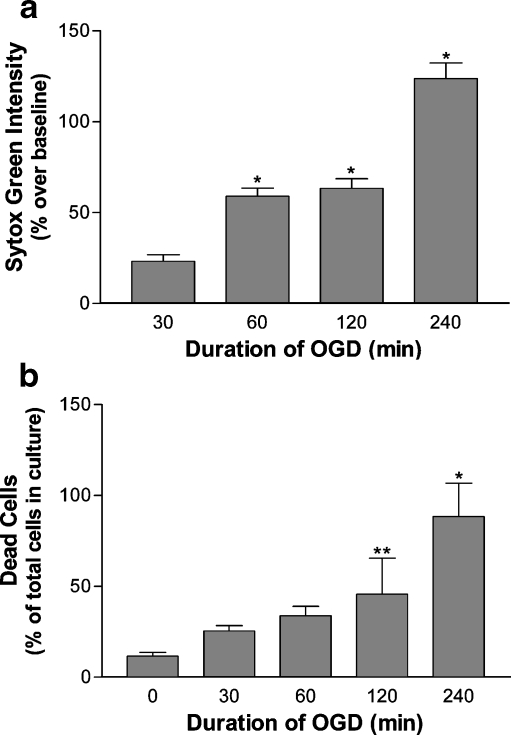
Fig. 5.
Cell death after increasing periods of OGD and a 24-h recovery period. Cultures subjected to durations of OGD between 0 and 240 min, recovered in normal culture conditions for 24 h and stained with Sytox Green (1 µM). Sytox Green intensity was measured by plate reader. Sytox Green intensity was analyzed as percent increase over baseline 24 h (a) after 30 (23.06% ± 3.75), 60 (58.95 ± 4.48), 120 (63.36% ± 5.32), and 240 min (123.74% ± 8.62) of OGD. Measurements following 60 to 240 min were significant (*p < .001, n = 47). Sytox Green-positive cells were analyzed as a percentage of all cells in culture after the 24-h recovery period (b) following 0 (11.6% ± 0.113), 30 (25.3% ± 0.194), 60 (33.8% ± 0.167), 120 (45.7% ± 0.166), and 240 min (88.3% ± 0.113) of OGD *p < .001, **p < .05

