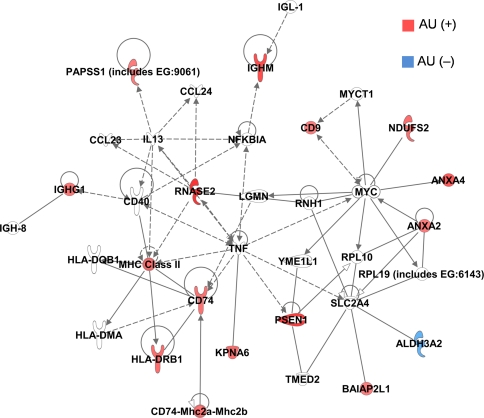
Fig. 6.
The top network that came from the 48 probe sets that correlated significantly (p(log2 Pb) ≤ 0.05) with lead levels in both AU and TD, but for which the correlation coefficients were significantly different between the two groups (p(Diagnosis × log2 Pb) < 0.05). This network is associated with immunological and inflammatory disease processes. AU (+) (Red) represents probe sets that positively correlated with lead levels in AU. AU (–) (Blue) represent probe sets that negatively correlated with lead levels in AU. (Color figure online)

