
Figure 2.
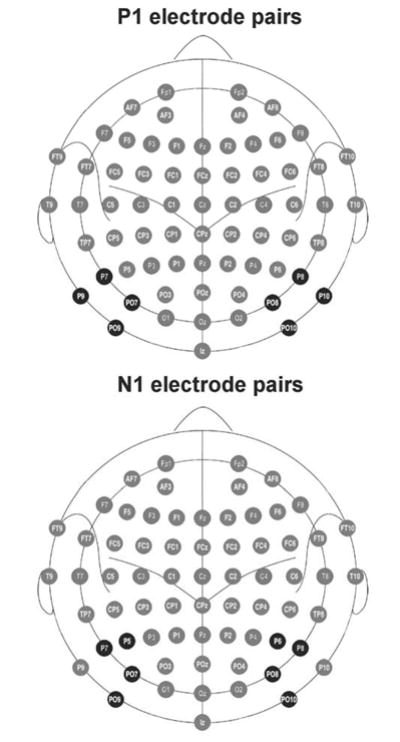
A schematic of the electrode pairs, shaded in black, that were investigated in the analyses of the P1 (top) and N1 components (bottom) of the visually-evoked potentials, and from which inter-hemispheric transfer times (IHTTs) were subsequently calculated. The P1 component was measured from electrodes P7/P8, P9/P10, PO7/PO8 and PO9/PO10. The N1 component was measured from electrodes P5/P6, P7/P8, PO7/PO8 and PO9/PO10. These electrode pairs were chosen separately for each component on the basis that they showed the largest peak amplitudes to contralateral visual stimuli. Image modified from Oostenveld and Praamstra (2001).