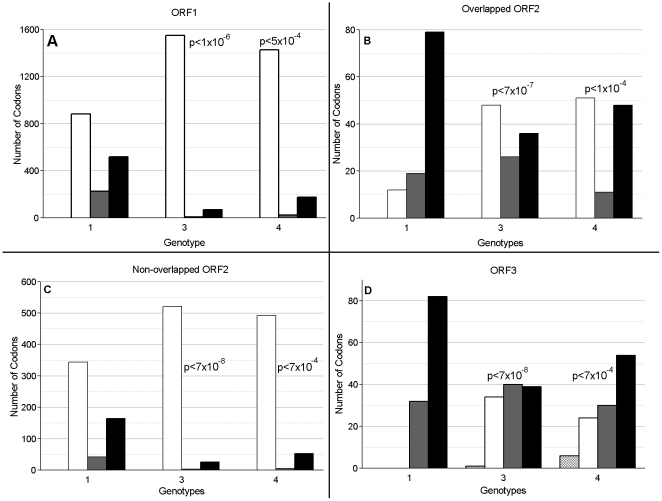
Figure 1. Evolutionary pressure across selected regions of the HEV genome by genotype.
The regions of the HEV genome examined are A) ORF1, B) overlapped region of ORF2, C) non-overlapped region of ORF2 and D) ORF3. Selective pressure was calculated using 1 rate Fixed Effects Likelihood using HyPhy [24]. Positive selection is shown by the diagonally hatched bar, negative selection is shown by the white bar, neutral selection is shown by the gray bar and invariant sites are shown by the black bar. The chi-square p value (with Yates continuity correction) for variable versus invariant sites between genotype 1 and either genotypes 3 or 4 is shown by the values placed next to the genotype 3 and 4 data, respectively. The best chi-square value for genotype 3 against genotype 4 is p<0.15.

