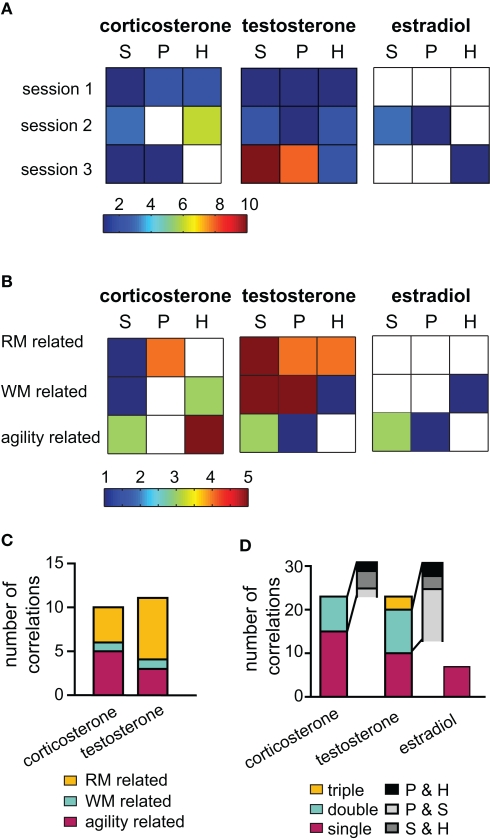
Figure 3.
Correlation analysis of hormones and behavioral data. To illustrate the relevancy of hormones over the training course, in (A) the number of significant correlations per session (acute groups G1, G2, and G3 only) are depicted color coded for each tissue type (S = serum, P = PFC and H = hippocampus). Testosterone expressed the highest number of significant correlations in the last session. In (B) the same data was arranged with parameters classified into three behavioral categories: working memory (WM), reference memory (RM) or unspecific activity (agility) related. (C) Outcome of the multiple regression analysis grouped according to the behavioral classification. (D) Illustrates the number of correlations occurring between a behavioral parameter and tissue types: if the parameter correlated significantly with one tissue only, it is termed “single,” “double” for two tissues and triple if correlation occurred between the parameter and all three samples. The gray insets illustrate the tissue pairs present in the double correlation bar.

