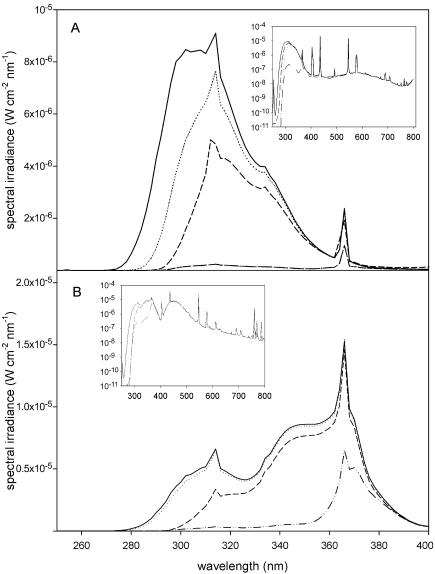
Figure 1.
A, Standard UV source used in studies for βGlu induction and UV/WL source used in experiments for flavonoid induction measured with a 250- to 800-nm double-monochromator spectroradiometer (model OL 754, Optronic, Orlando FL). A, Spectral irradiance of the standard UV source under transmission cut-off filters WG 360 (- - - -), WG 295 (· · · ·), WG 305 (—·—), and without filter (——). B, Spectral irradiance of the UV/WL source under transmission cut-off filters WG 360(—··—), WG 295 (· · · ·), WG 310 (- - - -), and under quartz (——). For better overview, the spectral irradiance in the UV range is given in linear scaling. Total spectral irradiance of the light sources (inset) is shown in logarithmic scale.

