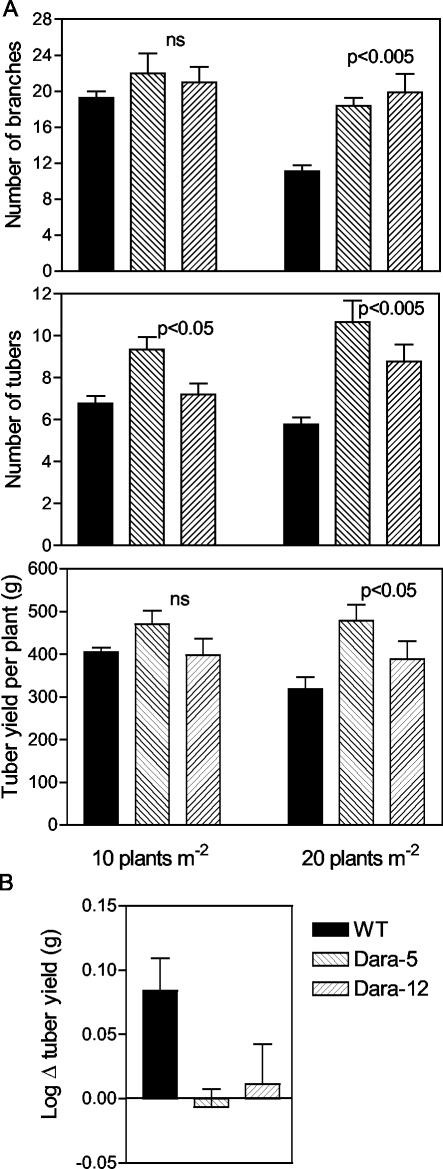
Figure 2.
Field performance of potato plants either of the WT (Desiree) or of lines expressing the Arabidopsis PHYB transgene (Dara-5 and Dara-12). A, Number of branches, number of tubers, and tuber yield. Plant density was 10 or 20 plants m-2 (70 or 35 cm between rows, respectively). B, Tuber yield response to plant density. Note that the se overestimates the error used in ANOVA because blocking reduced the error.

