
Figure 4.
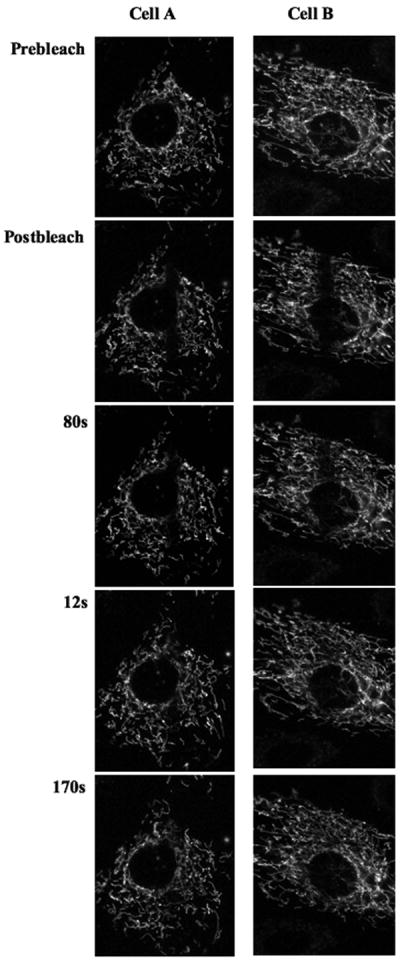
Fluorescence Recovery after Photobleaching on mitochondrial population. Experiment was performed in a fibroblast line stably expressing mitoRFP following Basic Protocol 2. Prebleach and postbleach images depict mitochondria before and after the single bleaching pulse respectively. The numbers represent time after post bleach in seconds. Two cells, A and B, have been shown to compare different recovery kinetics. 543 HeNe laser line was used for imaging and other imaging settings used is mentioned in Table 2.