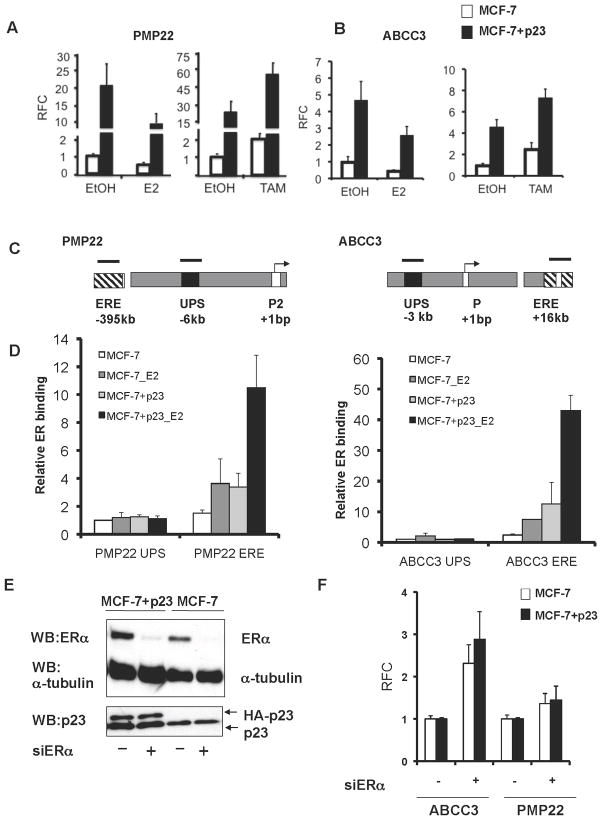
Figure 3. ER recruitment to distal EREs is associated with repression of PMP22 and ABCC3 gene expression.
MCF-7 control (white bars) and MCF-7+p23 cells (black bars) were hormone- starved for three days, treated for 16h with 1nM 17-β-estradiol (E2) (A and B, left panels) or 100nM 4-hydroxytamoxifen (TAM) (A and B, right panels) and mRNA was analyzed by qRT-PCR. Data are means from six independent experiments and presented as in Figure 1c. C) Schematic of PMP22 and ABCC3 loci containing transcription start sites (arrows), ER binding elements as determined by global ChIP-Chip analysis (ERE, striped boxes) and control upstream regions (UPS, black boxes). Black bars represent regions amplified by PCR to determine the level of ER recruitment. D) The relative amount of ER binding, in the presence or absence of E2, was determined by ChIP, followed by qRT-PCR. Data are shown as the averages, with standard error between replicate experiments, normalized to input for each sample, and expressed relative to ER recruitment at the corresponding UPS in MCF-7 control cells, set to 1. E) Depletion of ER protein by RNAi using ER (siER) and control siRNAs (siControl) verified by immunoblotting. F) ABCC3 and PMP22 gene expression levels upon depletion of ER were obtained by qRT-PCR. Shown are the averages obtained from three independent experiments normalized to GAPDH and presented as relative fold-change (RFC) between siER (+) and siControl (−) transfected cells, with siControl cells set to 1.

