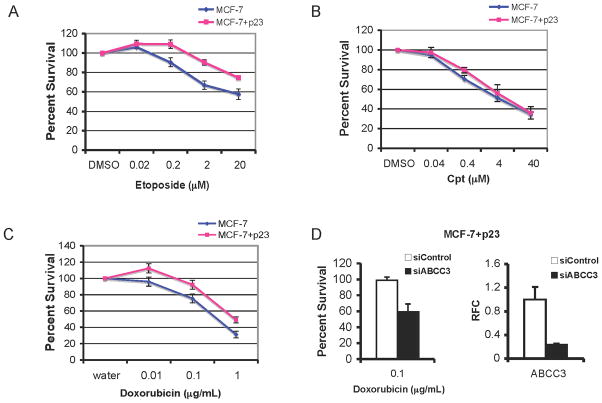
Figure 4. Increased ABCC3 gene expression in MCF-7+p23 cells mediates doxorubicin resistance.
A) MCF-7 control (blue) and MCF-7+p23 cells (pink) cells were treated with the indicated concentrations of etoposide; B) camptothecin (Cpt); or C) doxorubicin. Percent survival upon increasing concentrations of drugs was determined using the sulphorhodamine B (SRB) dye, which coats cells evenly so optical density (OD) values are proportional to cell number. Data are expressed as averages of at least three independent experiments with untreated cells set at 100% survival. Error bars represent standard error. D) MCF-7+p23 cells were transfected with siRNA against ABCC3 (siABCC3) or a control siRNA (siControl), and percent survival of doxorubicin treated relative to untreated cells is shown (left panel). Data from quadruplicate points were averaged from two independent experiments and error bars represent standard error. ABCC3 mRNA levels from siABCC3 and siControls were measured by qRT-PCR (right panel).

