
Figure 5. p23 expression and clinical outcome in human breast cancer.
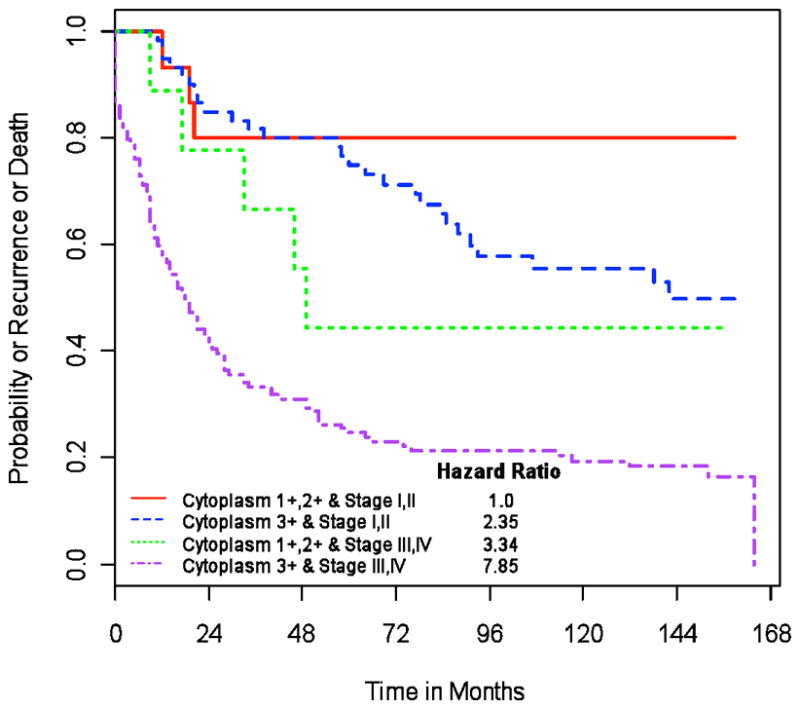
Kaplan-Meier curves plotting time to recurrence (in months) versus survival probability are shown for patients with stage I/II disease and low p23 (red solid line), stage I/II disease and high p23 (blue dotted line), stage III/IV disease and low p23 (green dotted line), or stage III/IV disease and high p23 (purple dotted line). Hazard ratios were calculated using multivariable Cox proportional hazards models and are shown for patients classified according to stage (I/II or III/IV) and p23 expression levels (low, 1+ or 2+; high, 3+).