
Figure 1. Clusterin inhibits tumor growth and angiogenesis.
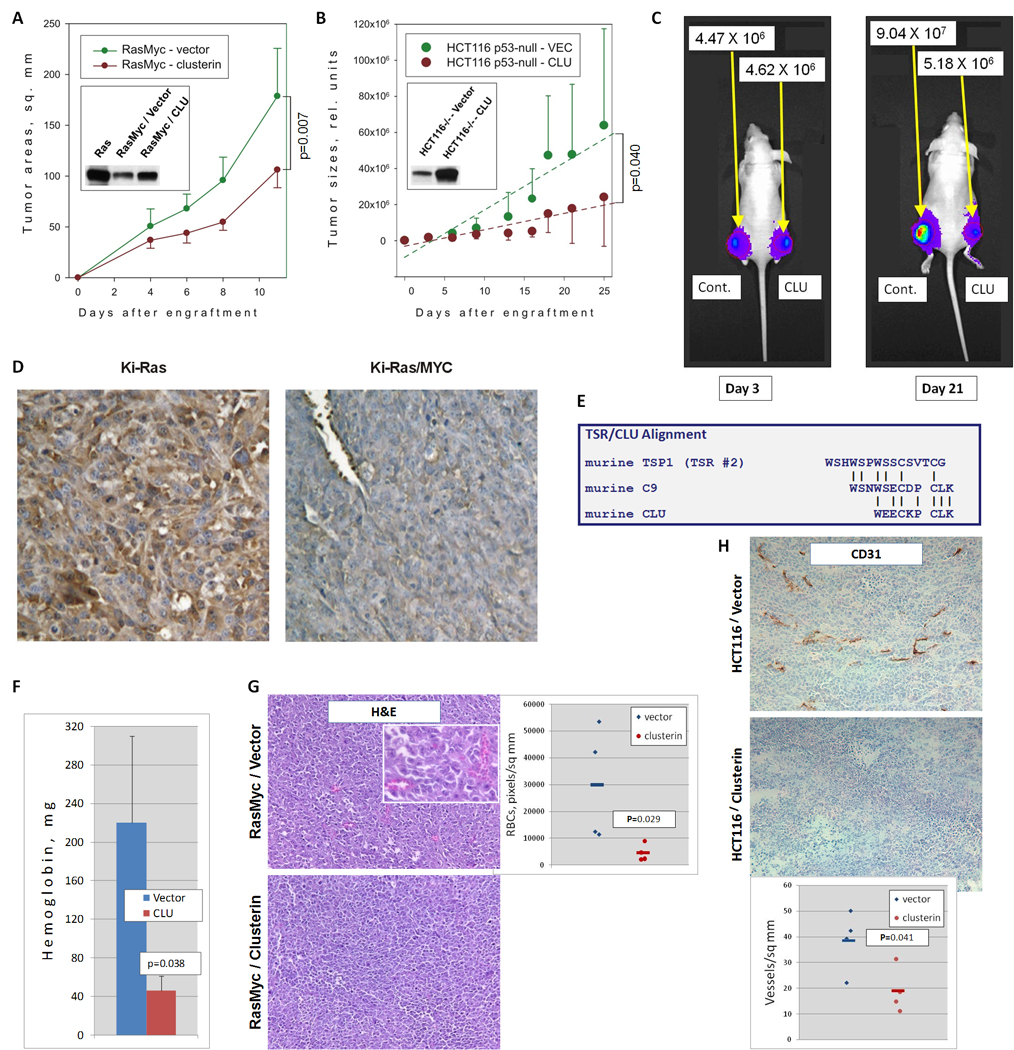
A. Growth of subcutaneous tumors derived from RasMyc cells transduced with a retrovirus expressing murine clusterin and/or the puromycin resistance gene. Inset represents immunoblot of clusterin levels in Ras and RasMyc colonocytes. B. Growth of subcutaneous tumors derived from HCT116 cells transduced with an empty vector or the retrovirus expressing human clusterin. Regression lines represent average rates of growth. The p-value refers to the difference in regression coefficients. Inset represents immunoblot of clusterin levels in transduced cells. C. In vivo bioluminescent imaging of representative animals from the experiment in B. Mice were photographed at days 3 and 21 after injection. No less than 5 animals per group were utilized in all these experiments. D. Immunohistochemical staining of Ki-Ras and Ki-Ras/Myc tumors with an anti-clusterin antibody. Cytoplasmic staining for clusterin is depicted in brown whereas nuclei are counterstained in blue. E. Alignment of the second TSR of murine thrombospondin-1 with the C9 protein and clusterin. F. Hemoglobin content of Matrigel pellets seven days after injection. Matrigels were admixed with p53-null mouse colonocytes transduced with either empty vector (blue bar) or clusterin retrovirus (red bar) and injected s.c. into syngeneic host animals. G. Hematoxylin/eosin staining of RasMyc/vector (top) and RasMyc/clusterin (bottom) tumor sections. Perfused blood vessels contain numerous red blood cells, which could be clearly seen under higher magnification (inset). The scatter plot represents densities of perfused blood vessels in 4 individual tumors. H. Immunohistochemical staining of control (top) and clusterin-overexpressing (bottom) HCT116 tumor sections with antibody recognizing the endothelial cell surface antigen CD31. The scatter plot represents densities of CD31-positive blood vessels in 4 individual tumors.