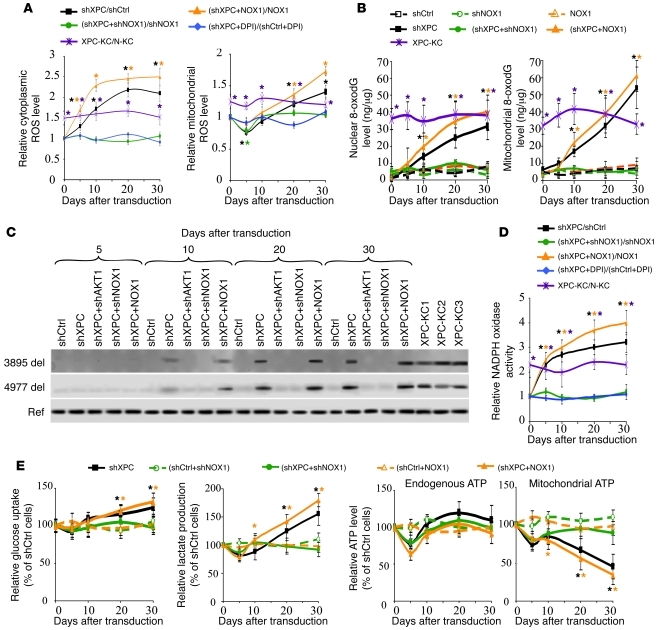
Figure 2. XPC silencing–induced ROS production leads to mtDNA deletions.
(A) ROS levels in different cells were measured by flow cytometry using cytoplasmic- and mitochondrial-specific probes at the indicated days after transduction. The ROS level in the shCtrl-transduced cells was arbitrarily set to 1. Results are then assessed as shown at the top of the panels and expressed as the mean ± SD of 3 independent experiments. (B) Genomic and mtDNA oxidation were assessed by quantification of 8-oxodG levels in nuclear genome and mtDNA of different cells. Results are expressed as ng of 8-oxodG per μg DNA. (C) mtDNA was extracted and subjected to PCR, amplifying either reference fragments (Ref) representing total mitochondrial genome or 2 known deletions (3895 del and 4977 del). (D) NADPH oxidase activity was assessed as shown at the top of the panels and expressed as the mean ± SD of 3 independent experiments. (E) Glucose consumption and lactate production as well as the total endogenous ATP levels and ATP levels produced by mitochondria were measured in the different transduced cells. *P < 0.05 for different cells versus shCtrl-transduced cells at the indicated time points.

