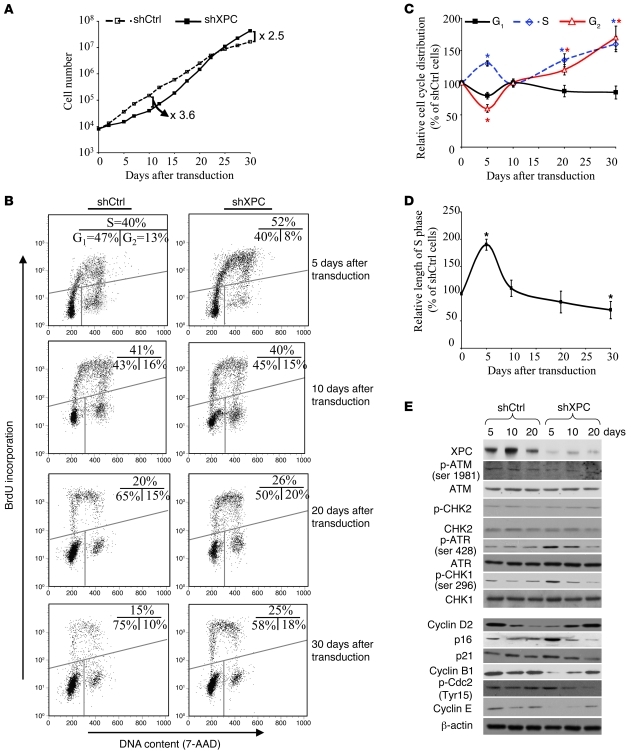
Figure 3. XPCKD cells display increased proliferative capacity associated with an increased fraction of S phase cells and decreased length of S phase following an initial stalled phase.
(A) The proliferation capacities of shCtrl- or shXPC-transduced keratinocytes were measured by serial cell counts on different days after transduction. (B) The distribution of cells in the G1, S, and G2 phases was measured at the indicated time intervals after transduction using 7-AAD and BrdU staining. (C) Graphic representation of the distribution of cells in the G1, S, and G2 phases. The percentage of cells in each phase for shCtl-transduced keratinocytes was considered to be 100%. The results were then compared with the shCtrl and are expressed as the mean ± SD of 3 independent experiments. (D) DNA synthesis time was measured by a BrdU pulse assay. Results are shown as the average percentages of shCtrl ± SD of 3 independent experiments. *P < 0.05 for shXPC-transduced cells versus shCtrl-transduced cells at the indicated time points. (E) Total protein extracts were assessed for cell-cycle regulators by Western blot analysis. β-actin was used as a loading control.

