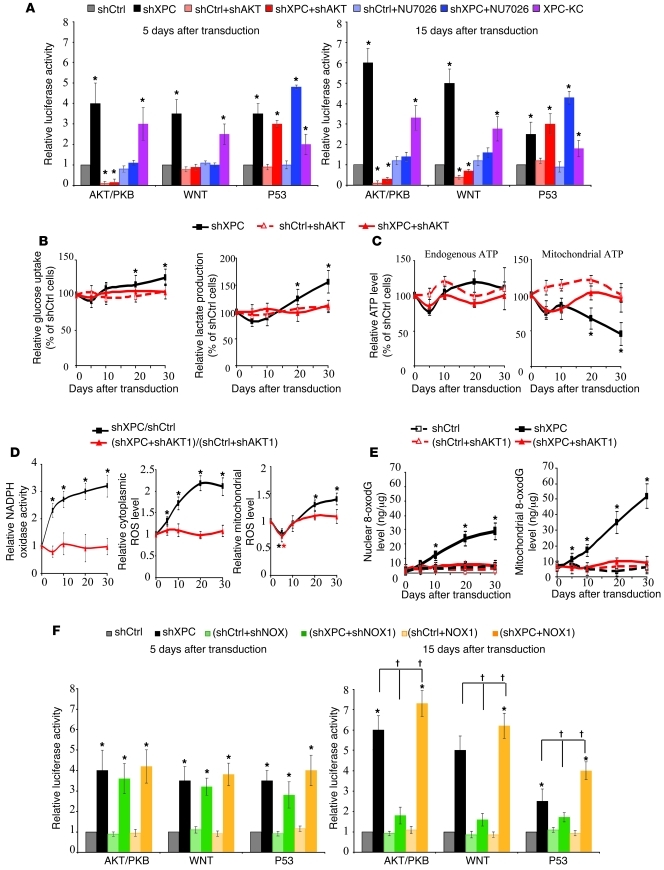
Figure 6. AKT activation in XPCKD cells triggers NADPH oxidase activation and metabolic alteration.
(A) To assess activation of different cancer pathways, luciferase-reporter lentivirus was used to transduce the keratinocytes in the indicated conditions at days 5 and 15. For each reporter, the mean ± SD luciferase activity is presented as the relative value to the activity in shCtrl-transduced cells (n = 3). (B and C) Glucose consumption and lactate production (B) as well as the total ATP levels and ATP levels produced by mitochondria (C) were measured in the different cells. The results were then compared with the shCtrl and are expressed as the average percentage of shCtrl ± SD of 3 independent experiments. (D) NADPH oxidase activity and cytoplasmic and mitochondrial ROS levels were measured in different transduced cells. (E) The effect of AKT on XPC silencing–induced genomic and mtDNA oxidation were assessed by quantification of 8-oxodG levels in nuclear and mtDNA. (F) To assess the effect of NOX1 on activation of AKT, WNT, and P53 pathways following XPC downregulation, luciferase reporter lentivirus was used as described in A. *P < 0.05 for indicated cells versus shCtrl; †P < 0.05 for indicated cells versus shXPC-transduced cells. Results are presented as mean ± SD.

