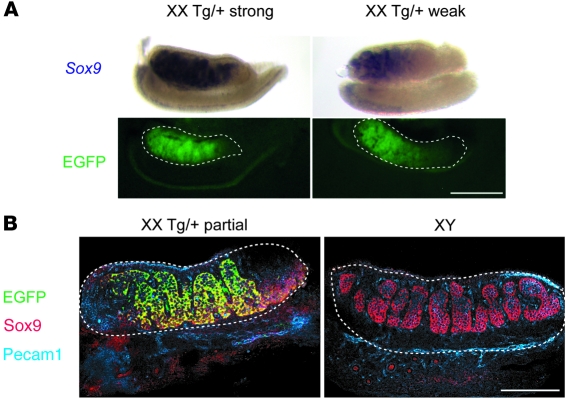
Figure 3. 13.5-dpc XX Tg/+ gonads show variable cord formation and Sox9 expression that coincides with the spatial localization of transgene (EGFP) expression.
(A) Sox9 expression and corresponding EGFP expression in representative XX Tg/+ (strong), and XX Tg/+ (weak) 13.5-dpc gonads. Scale bar: 250 μm. (B) Optical slices of whole mount 12.5-dpc XX Tg/+ and XY gonads stained with EGFP (green), Sox9 (red), and Pecam1 (blue). The dotted lines indicate the outline of the gonads. Scale bar: 150 μm.

