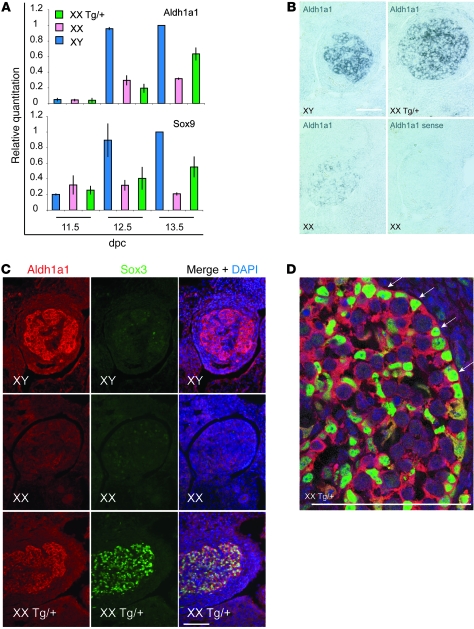
Figure 7. Expression profile of Aldh1a1/Aldh1a1 and Sox3 in XY and XX Tg/+ gonads from 11.5 to 13.5 dpc.
(A) qRT-PCR analysis of 11.5- to 13.5-dpc gonads. Normalized expression levels of each gene are shown relative to β-actin. Two cDNA series were analyzed twice each, and error bars represent SD of the mean of the two series. (B) In situ hybridization showing Aldh1a1 expression in transverse sections of 13.5-dpc XY, XX Tg/+, and XX gonads. No signal was detected using an Aldh1a1 sense probe. (C) Transverse sections of XY, XX Tg/+, and XX 13.5-dpc gonads stained with Aldh1a1, Sox3, and DAPI. Protein expression levels are consistent with the transcript expression analysis shown in B. (D) Confocal micrograph of 13.5-dpc XX Tg/+ gonad showing the extensive overlap in Sox3 and Aldh1a1 expression. Arrows indicate Sox3/Aldh1a1-positive cells lining the testis cords. Scale bars: 100 μm.

