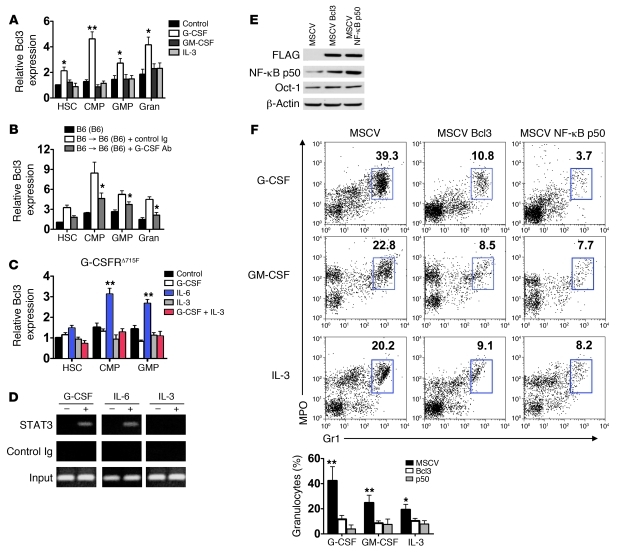
Figure 5. The dynamics and effects of Bcl3 expression in myeloid progenitors.
(A) Representative (n = 4) Bcl3 transcript expression in B6 myeloid progenitors or granulocytes (Gran) before (control) and after 18 hours of stimulation with 10 ng/ml of indicated cytokines in liquid culture. (B) Representative (n = 4) Bcl3 transcript level expression in myeloid progenitors and granulocytes purified from resting B6 mice, B6 → B6 (B6) treated with control Ig or G-CSF–specific antibodies 18 hours following transplantation. (C) Representative (n = 2) Bcl3 transcript accumulation in G-CSFRΔ715F myeloid cell progenitors. (D) Representative (n = 2) analysis of STAT3 association with Bcl3 promoter. Lin– B6 bone marrow cells were stimulated with indicated cytokines. Chromatin immunoprecipitation was then conducted with STAT3-specific or control antibodies, and amplification was performed with primers specific for an enhancer region of Bcl3. (E) Assessment of Bcl3 ectopic expression on NF-κB p50 protein accumulation. Lin– B6 bone marrow cells were transfected with MSCV, MSCV-Bcl3 (encoding N-FLAG Bcl3), or MSCV NF-κB p50 (encoding N-FLAG NF-κB p50). Nuclear protein was extracted, immunoblotted, and probed with FLAG–, NF-κB p50–, Oct-1–, and β-actin–specific antibodies. Results are representative of 3 independent experiments. (F) Top: Representative FACS analysis (n = 5). Numbers denote percent abundance of granulocytes in Lin– bone marrow cell cultures following 3 days of stimulation with indicated cytokines. Bottom: Mean percent abundance of granulocytes calculated from 5 independently conducted cultures derived from data in top panel. Data represent mean ± SD. *P < 0.05; **P < 0.01.

