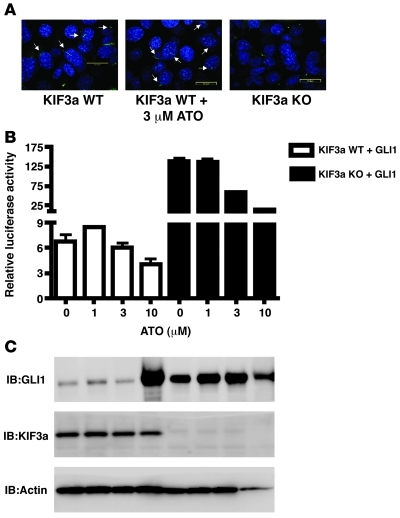
Figure 3. ATO does not inhibit GLI1 by affecting primary cilia.
(A) Effects of ATO on primary cilia were visualized using confocal fluorescence microscopy on MEFs stained for acetylated tubulin. Arrows indicate cilium. Scale bars: 20 μm. (B) KIF3a WT and knockout cells were transfected with pGL38XGLI and EGFP-GLI1. The Renilla-TK construct was used as a control for normalization. 24 hours later, cells were treated for 24 hours with ATO at 1, 3, and 10 μM. Mean ± SD relative luciferase activity was calculated relative to Renilla activity. Transfection assays were performed in triplicate. (C) Expression of GLI1 and KIF3a were detected by IB.

