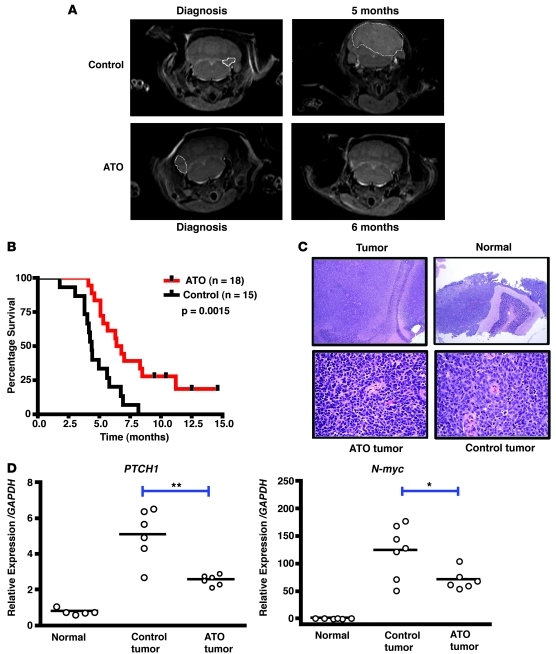
Figure 7. Survival of ND2:SMOA1 mice is increased by ATO treatment.
(A) MRI images of representative animals before treatment and 5–6 months after treatment. Dashed circles denote tumors. (B) The survival of ATO-treated (n = 18; 0.15 mg/kg 3 times per week) and untreated (n = 15) ND2:SMOA1 mice were compared (P = 0.0015, Kaplan-Meyer analysis). Tick marks on the graph represent animals that were still alive at the end of the study. (C) Representative H&E sections from control and ATO-treated tumors. In each case, a histologically classical medulloblastoma was observed arising in cerebellum. Low-power images (top) show tumor and normal cerebellum, high-power images (bottom) show tumor. Upper panels images are at ×40 and the lower panel images are at ×400 magnification. (D) qRT-PCR was performed to evaluate changes in GLI target genes PTCH1 and N-myc of control tumors (n = 7), ATO-treated tumors (n = 6), and normal cerebellum (n = 6). Expression was normalized to GAPDH levels. Mean relative expression levels were calculated using the comparative Ct method. *P < 0.05,**P < 0.01, 2-tailed Student’s t test. Each condition was performed in triplicate.

