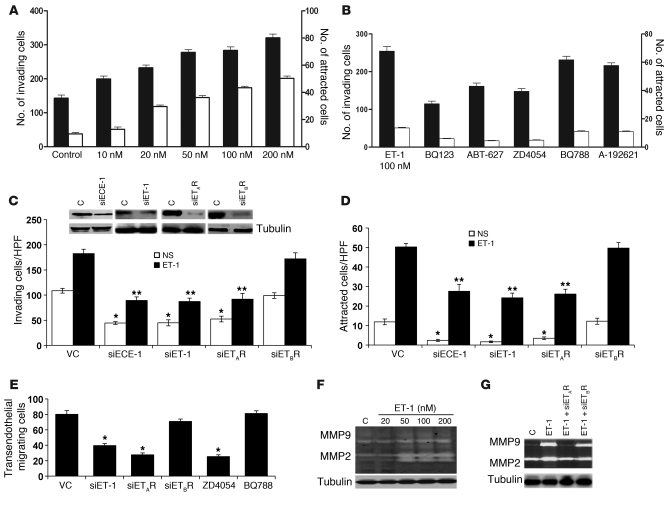
Figure 3. ET-1 induces bladder cancer cell invasion, chemotaxis, transendothelial migration, and proteolytic activity.
(A) UMUC3 cells (1 × 10⁵ cells/100 μl, MEM-0.4% BSA) were added to the upper chamber of Matrigel-coated, 8-μm-pore-size polycarbonate inserts. Cells were allowed to invade matrix-coated inserts to the bottom chamber containing CGM or ET-1 (10–200 nM) in SFM. Invasion (black bars)/migration (white bars) assays were carried out for 5 hours. Cells attached to the bottom surface of the inserts were stained with DiffQuick and counted. UMUC3 cells were treated with ETAR inhibitors (BQ123, ABT-627, and ZD4054) or ETBR inhibitors (BQ788 and A-192621) (B) or transfected with siRNA targeting ET-1, ECE-1 (100 nM) or siETAR, siETBR (200 nM) or mock vector control siRNA (VC). Effective knockdown was determined in harvested cells 48 hours after transfection by Western blot (C, inset). Cells were then used for Matrigel invasion (C) and chemotaxis (D) assays as described above. *P < 0.05, compared with nonstimulated (NS) VC; **P < 0.05, compared with ET-1 stimulation, Student’s t test. (E) UMUC3 cells knocked down or not with siET-1/siETRs or treated with ZD4045 and BQ788 were allowed to traverse PMVECs grown on 8-μm inserts. Assays were carried out for 6 hours, after which cells on the undersurface of the inserts were counted. Bars represent mean ± SEM of 3 independent experiments performed in triplicate. *P < 0.05, Student’s t test. (F and G) UMUC3 cells transfected or not with siET-1, siETAR, and siETBR were stimulated with ET-1 (100 nM) in SFM for 72 hours. CM was collected, and MMP2 and MMP9 activity was detected in 10× CM. Cell lysates were probed with α-tubulin as loading control.

