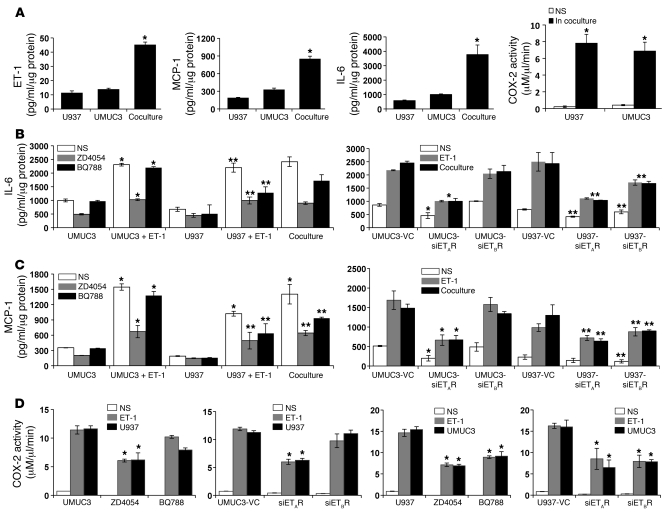
Figure 4. Involvement of ET-1 axis in UMUC3 macrophage–induced inflammation.
(A) ET-1, MCP-1, and IL-6 production measured in CM collected at 72 hours from U937 and UMUC3 cells in single-cell and co-cultures, in which U937 was added on the top of cell-impermeable 0.4-μm inserts, without cell-cell contact, with UMUC3 monolayers in the bottom chambers. COX-2 activity was detected in cell lysates under the same experimental conditions. Bars represent the mean ± SEM of 2 independent experiments performed in triplicate. ET-1 and cytokine levels as well as COX-2 activity were normalized to protein content of the cell lysates in single-cell cultures and cell proliferation as detected by CyQuant.*P < 0.05, comparing coculture with either single NS cell culture. IL-6 (B) and MCP-1 (C) were measured in CM, collected at 72 hours, of UMUC3 and U937 cells either NS, stimulated with ET-1 (100 nM), or cocultured together, in the presence or absence of ZD4054 and BQ788. Alternatively, cells were transfected with siETAR or siETBR, before stimulation with ET-1 or coculture with the nontransfected other cell line. IL-6 and MCP-1 values were corrected to protein content of cell lysates. Bars represent the mean ± SEM of 2 experiments performed in triplicate. *P < 0.05, as compared with UMUC3 or UMUC3-VC; **P < 0.05, as compared with U937 or U937-VC. (D) COX-2 activity was measured in UMUC3 and U937 cell lysates under the same experimental conditions as in A and B. Bars represent the mean ± SEM of 2 experiments performed in triplicate. *P < 0.05, Student’s t test, as compared with corresponding control.

