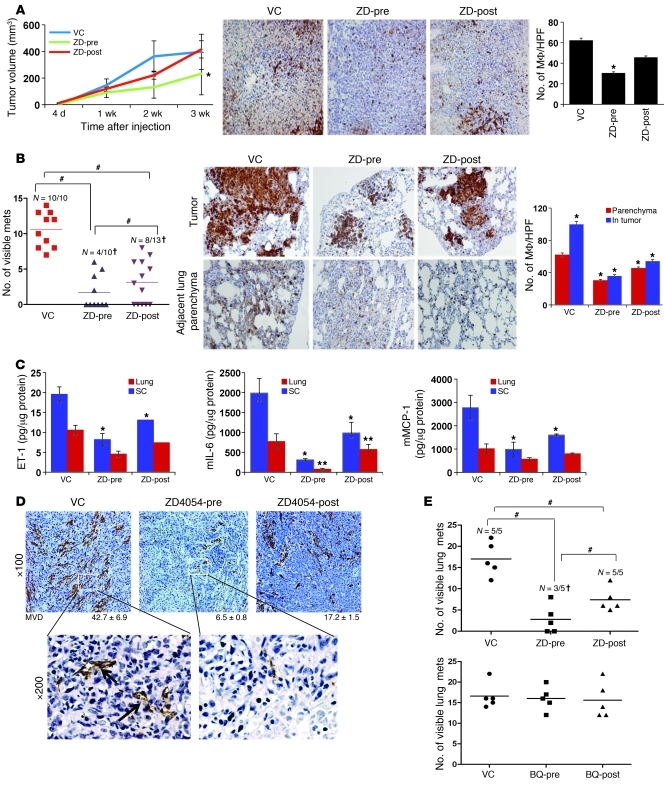
Figure 8. The effect of ZD4054 on primary tumor development and spontaneous lung metastasis in syngeneic immunocompetent C57BL/6 mice inoculated with MB49 murine bladder cancer cells.
(A–C) MB49 cells (5 × 10⁴ cells/100 μl) were injected s.c. in mice. Animals were assigned to 3 groups that received ZD4054 24 hours before MB49 injection (ZD-pre); vehicle control (VC); or ZD4054 1 week after tumor cell injection (ZD-post). (A) Kinetics of s.c. growth in 3 cohorts Typical example of macrophage immunostaining (total magnification, ×100) and quantification in s.c. tumors. Bars represent the mean ± SEM of macrophages/HPF as described above; *P < 0.05, Student’s t test, compared with VC-treated mice. (B) Incidence and number of visible metastases (mets) per lung in each cohort (left) following s.c. inoculation. †P < 0.0001, χ2 test; #P < 0.01, Student’s t test. Photomicrographs show infiltrating macrophages in lungs. Bars in the right panel represent mean ± SEM of the number macrophages within metastatic foci and in the surrounding lung parenchyma/HPF. *P < 0.05, as compared with VC-treated mice. (C) ET-1, MCP-1, and IL-6 detected in lungs and s.c. tumors. Bars represent mean ± SEM (n = 5/group). *P < 0.05, Student’s t test, compared with VC-treated mice. (D) Representative images of CD31 immunostaining of s.c. MB49 tumors showing MVD. Bars represent MVD ± SEM counted in 6 HPFs/sample. (E) Mice injected with MB49 cells (104 cells/100 μl) via tail vein were treated with ETR inhibitors (ZD4054, top, and BQ788, bottom) and were assigned to 3 cohorts for each inhibitor as described above. Scatter plot of incidence/number of visible lung metastases determined 3 weeks after injection. †P < 0.01, χ2 test; #P < 0.05, Student’s t test.

