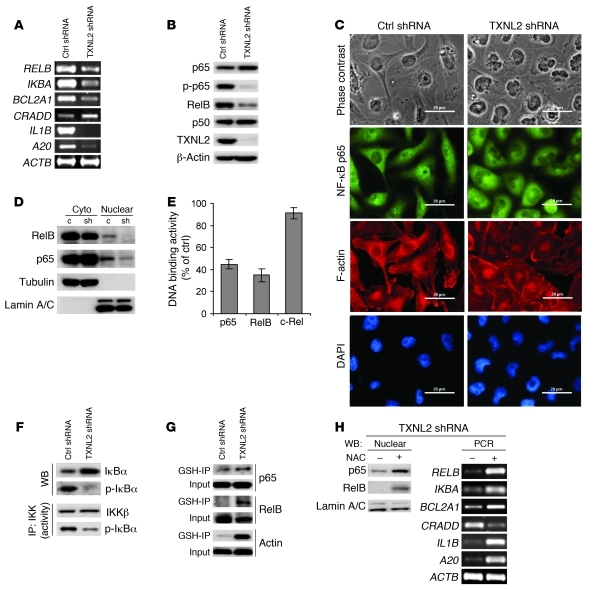
Figure 6. TXNL2 knockdown blocks NF-κB activity in breast cancer cells.
(A) Expression of NF-κB–regulated genes in control and TXNL2-KD cells was measured using semiquantitative RT-PCR. (B) Expression of NF-κB components was examined using immunoblotting. (C) Nuclear localization of p65 in control and TXNL2-KD MDA-MB-231 cells was visualized using indirect immunofluorescence staining. F-actin (red) was used to show cell morphology, and DAPI (blue) was used to show nuclei. Scale bar: 20 μm. (D) Expression of p65 and RelB in cytosolic (cyto) and nuclear fractions from control (c) and TXNL2 shRNA (sh) cells was examined using immunoblotting. Tubulin and lamin A/C were used as cytoplasmic and nuclear markers, respectively. (E) The relative DNA binding activities (% of control) of p65, RelB, and c-Rel were measured by TransAM DNA-binding ELISA. Data represent mean ± SD of 3 experiments. (F) In vitro IKK activity assays were performed. IKK activity was indicated by p-IκBα levels. Total IκBα and p-IκBα levels in control and TXNL2-KD cells were assessed using immunoblotting. (G) Glutathionylation of p65 and RelB was examined using GSH immunoprecipitation, followed by immunoblotting. (H) TXNL2-KD MDA-MB-231 cells were treated with NAC for 6 hours. Nuclear localization of p65 and RelB was examined by immunoblotting. NF-κB–regulated genes were measured by semiquantitative RT-PCR.

