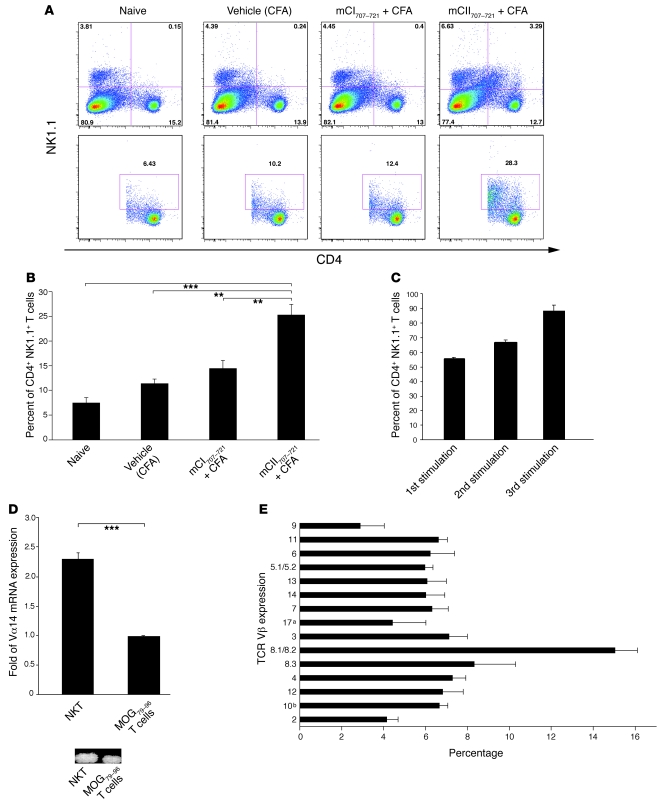
Figure 3. mCII707–721 induces NKT cell expansion.
(A and B) Splenocytes were taken from naive WT (B10.Q) mice and in vivo CFA-, mCI707–721–, and mCII707–721–treated mice. Single-cell suspensions were made and then stimulated with 100 μg/ml mCII707–721 for 48 hours. n = 3 mice per group. (A) A representative FACS staining shows total gated lymphocytes (upper row) and gated CD4+NK1.1+ NKT cells (lower row). (B) Percentage of CD4+NK1.1+ NKT cells from indicated groups. Data are mean ± SD, n = 3. **P ≤ 0.01; ***P ≤ 0.001. (C) Proportion of NK1.1+ T cells in cell line during the first stimulation of LNCs (57%), and after 2 (65%) and 3 (88%) in vitro stimulation cycles with mCII707–721. NK1.1+ T cells enriched after each stimulation, indicating response and proliferation after mCII707–721 exposure. Data are mean ± SD. n = 3. (D) mCII707–721–specific cell line characterized for TCR usage after 3 stimulation cycles with a significantly higher proportion of Vα14-Jα18 by real-time qPCR compared with control BQMOG79–96–specific T cells (top panel). Vα14 PCR product in agarose gel is shown (bottom panel). Data are mean ± SD. n = 3. ***P ≤ 0.001. (E) Splenocytes were taken from mCII707–721–immunized mice treated with 100 μg/ml mCII707–721 for 48 hours. FACS staining shows TCR Vβ usage. Percentages were computed relative to the sum of all of the 15 chains. Data are mean ± SD, n = 3.

