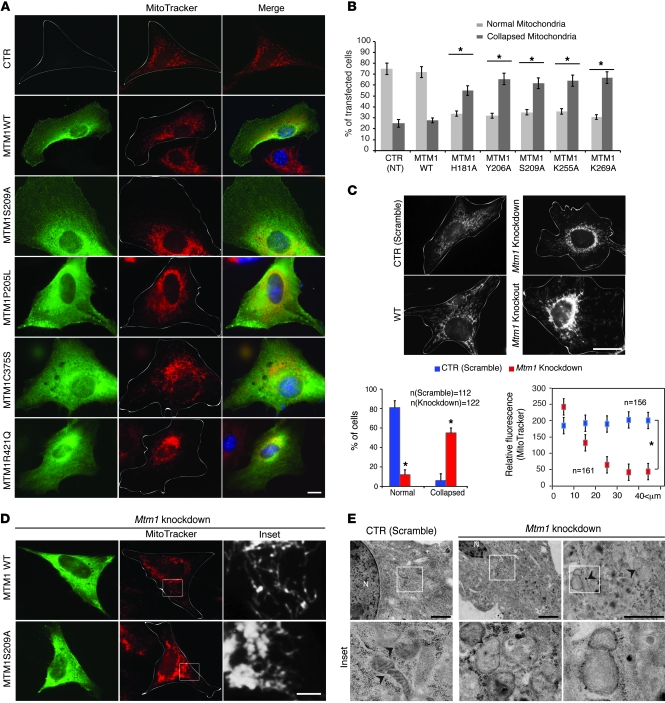
Figure 7. MTM1 has a role in mitochondrial dynamics in muscle cells.
(A) Effect of MTM1 mutations on mitochondrial morphology in C2C12 cells. Single cells are outlined. Scale bar: 10 μm. (B) Quantitation of mitochondrial phenotypes observed as normal or collapsed. More than 100 cells per transfection were counted for 2 independent experiments. Nontransfected (NT) cells served as a control. *P ≤ 0.05. (C) Confocal microscopy images after MitoTracker Red staining showed accumulation/collapse of mitochondria at the perinuclear region in Mtm1-KO and -KD myoblasts. Scale bar: 20 μm. Also shown is quantitation of mitochondrial phenotypes observed over 2 independent experiments, as well as position of mitochondria with respect to nuclei (0 μm) in control and Mtm1-KD C2C12 cells. *P ≤ 0.05. (D) Overexpression of MTM1-WT, but not MTM1-S209A, in Mtm1-KD cells restored mitochondrial morphology. Single cells are outlined (original magnification, ×63). Boxed regions are shown at higher magnification at right (scale bar: 10 μm). (E) Ultrastructural observations of Mtm1-KD cells by electron microscopy revealed the presence of swollen mitochondria (arrowheads). Boxed regions are shown at higher magnification below (original magnification, ×20,000). Scale bars: 1 μm.

