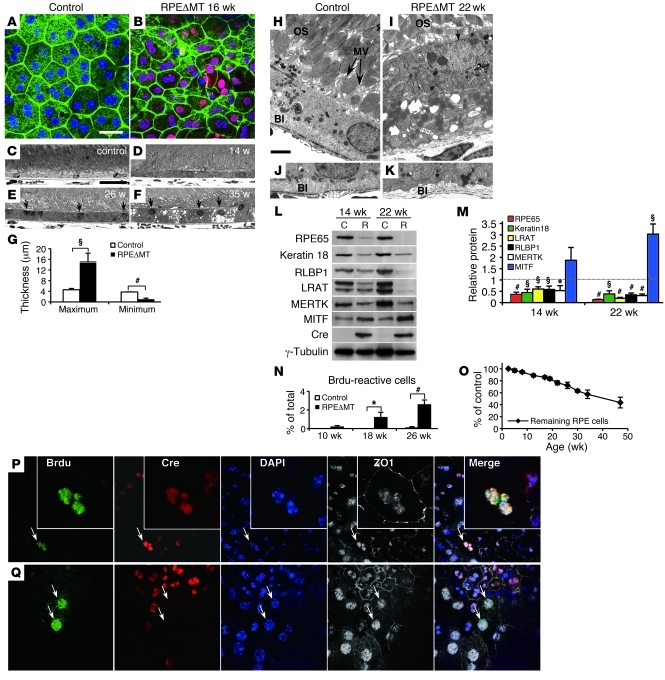
Figure 2. RPE dedifferentiation and hypertrophy in RPEΔMT mice.
(A and B) RPE flat mounts stained for cre (red) and phalloidin (green) show (B) loss of cuboidal appearance in cre-reactive cells in RPEΔMT mice at 16 weeks of age. (C–F) Light microscopy reveals thickened RPE cells (D) in a 14-week-old RPEΔMT mouse. (E and F) Numerous RPE cells of RPEΔMT mice have progressively increased thickness and apical location of nuclei (arrows). (G) At 35 weeks of age, both maximum and minimum RPE thickness are significantly different between RPEΔMT mice and controls. (H–K) Electron microscopy in 22-week-old RPEΔMT mice (I and K) shows a thickened RPE cell, with apical location of nucleus, (I, arrow denotes nucleus, OS stands for outer segments) loss of microvilli (MV), (H) arrows denote MV, and (K) absent basal infoldings (BI). (L) Loss of a series of RPE-characteristic markers, with the exception of MITF, in RPE cells from RPEΔMT mice (R) versus control (C) is detected by immunoblot, and (M) confirmed by quantification of protein. (N) The percentage of BrdU reactive RPE cells at 2 days PI is significantly increased in RPEΔMT mice at 18 weeks and older. (O) However, RPEΔMT mice have a gradual loss of RPE cells over time. (P and Q) BrdU staining shows cre-expressing (P, arrows denote; insets are pictures of the same cell with higher magnification) and cre-negative RPE cells (Q, arrows) that have multiple BrdU-reactive nuclei within 1 cell boundary (denoted by ZO1) at 3 months PI. Original magnification, ×400. Error bars in G, M, N, and O represent SD from triplicates. Scale bars: 25 μm (A–F); 2 μm (H–K). *P < 0.05; §P < 0.01; #P < 0.001.

