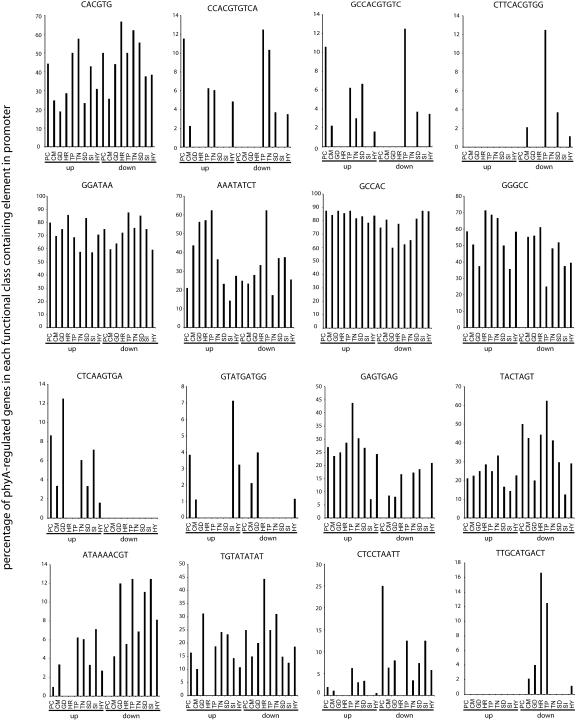
Figure 5.
Distribution of motifs by functional class of the downstream gene. The graphs each show the percentage of phyA-regulated genes in a given functional category containing an exact sequence motif in the promoter. The genes are grouped by the far-red-light response (induced [up] or repressed [down]) and by the functional category of the gene product. Functional categories are: PC, photosynthesis and chloroplast; CM, cellular metabolism related; GD, growth and development; HR, hormone related; TP, transmembrane transporters; TN, transcription; SD, stress and defense; SI, signaling; HY, hypothetical or unknown function (categories as defined by Tepperman et al. [2001]).

