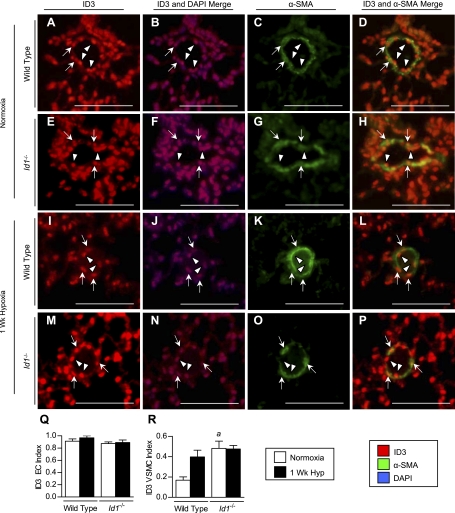
Fig. 9.
Localization of ID3 expression in peripheral pulmonary vessels in wild-type and Id1 null mouse lungs. A–P: immunofluorescence for ID3 using rabbit monoclonal antibody clone 17–3 (red) and mouse monoclonal anti-α-SMA (green) in small (20- to 50-μm) muscularized peripheral pulmonary vessels in wild-type (A–D, I–L) and Id1 null mice (E–H, M–P) under normoxic conditions (A–H) and after 1 wk of hypoxia (I–P). Nuclear staining with DAPI is shown in blue. M and N: quantification of cell-specific ID3 indexes in EC (Q) and VSMC (R) compartments in peripheral vessels from normoxic and 1-wk hypoxic wild-type and Id1 null mouse lungs, as indicated. Arrows indicate nuclear staining in VSMCs; arrowheads, ECs. Scale bar = 100 μm. Values are means ± SE (n = 4 each group). aP < 0.05 vs. wild-type normoxic control by one-way ANOVA with Bonferroni correction.

