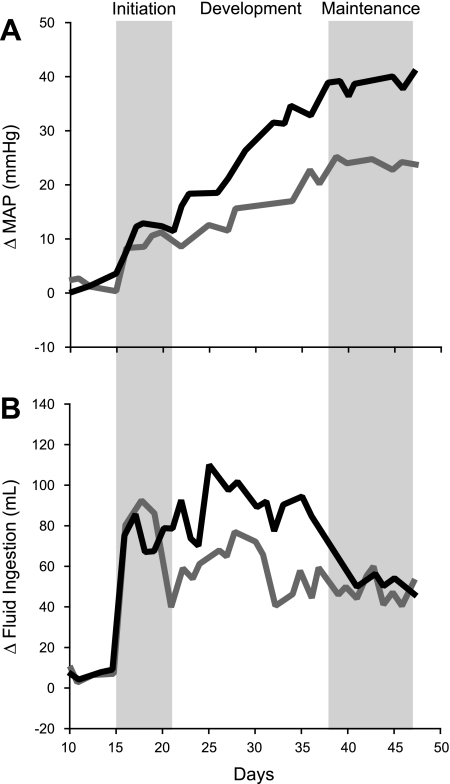
Fig. 6.
Phases in the development of DOCA-salt hypertension. Data from protocol 1 are replotted to highlight putative phases in the development of DOCA-salt hypertension. Vehicle-DOCA rat are indicated by the black line and Benzamil-DOCA rats are shown by the gray line. During the initiation phase, MAP increased rapidly in DOCA-salt-treated rats, followed by a brief plateau. During this same time, fluid ingestion also showed a marked increase. During the developmental phase, Vehicle-DOCA rats exhibited a second, more gradual increase in arterial pressure and maintained high levels of fluid ingestion. In the Benzamil-DOCA animals, a shift to the developmental phase was noted when fluid ingestion declined, with significantly less saline ingested in Benzamil-DOCA rats than Vehicle-DOCA rats on the transition day. Benzamil-DOCA rats also experienced a second, more gradual increase in MAP, but this was more modest than the rise exhibited by Vehicle-DOCA rats. During the maintenance phase, both groups showed stable levels of MAP, significantly above that of control animals, and both groups showed reduced fluid ingestion.

