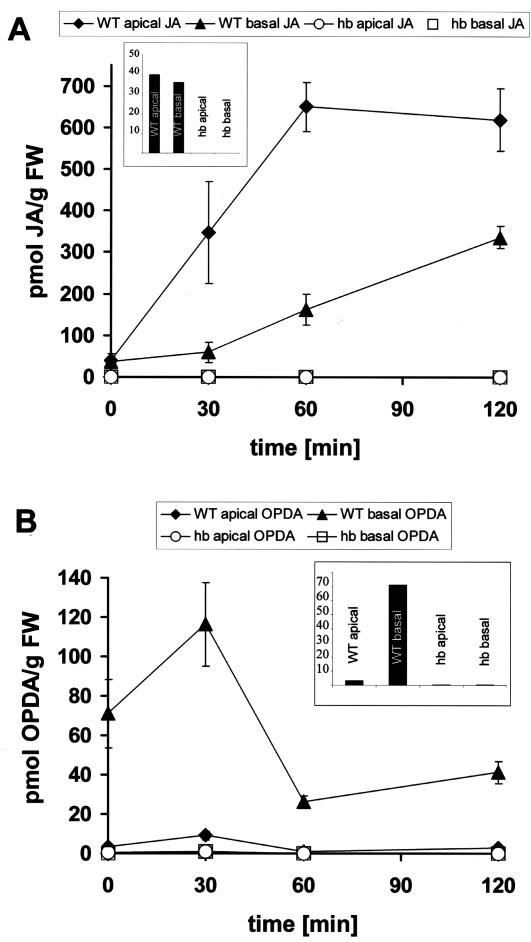
Figure 4.
Response of JA (A) and OPDA (B) to red light in coleoptiles from wild type (WT) and hebiba (hb). For details, refer to the legend of Figure 3. The insets show basal levels of both, JA (A) and OPDA (B) present in etiolated coleoptiles. The data represent averages from at least five independent experimental series comprising 500 to 600 individual coleoptiles for A and at least 17 independent experimental series comprising 850 to 1,300 individual coleoptiles for B. FW, Fresh weight.

