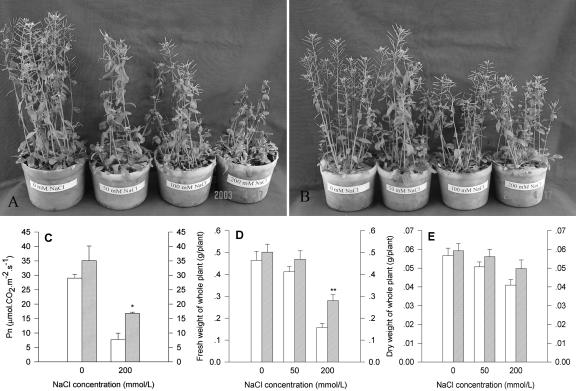
Figure 5.
Increased resistance to NaCl stress of transgenic plants overexpressing SOD2. Phenotypes of wt (A) and T4 transgenic plants of line S04-9 (B) after the NaCl treatment. Left to right, Concentrations of NaCl were 0, 50, 100, and 200 mm, respectively. wt plants and transgenic plans were grown on soil and watered every 3 d until they were subjected to NaCl stress. The Pn (C) of the leaf, fresh weight (D), and dry weight (E) of whole plant were measured when the NaCl treatment was finished. White and cross-hatched line bars, wt and S04-9, respectively. * and **, Significantly different from the wt at P < 0.05 and 0.01, respectively, by Student's t test.

