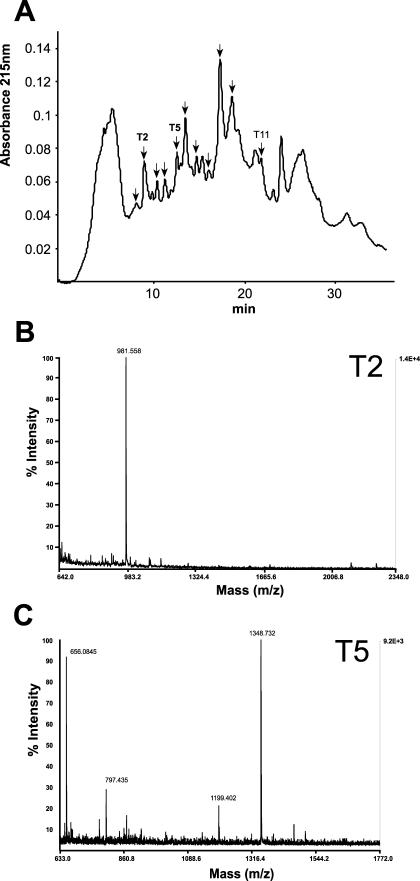
Figure 4.
Separation of trypsin digested fraction four (see Fig. 3) by RP-HPLC (A) and representative examples of analysis of two fractions by MALDI-TOF MS (B and C). A, Separation of trypsin-digested proteoglycans in fraction four (see Fig. 3) by RP-HPLC. Fractions indicated by arrows were analyzed by MALDI-TOF MS (Table I), and fractions T2, T5, and T11 were used for N-terminal Edman sequencing (see Table II). B, MALDI-TOF MS spectrum of fraction T2 from RP-HPLC profile of peptide digest. The ion at m/z 981.558 matches the expected mass of a tryptic peptide of FLA7, FTDVSGTVR (981.501 Da). C, MALDI-TOF spectrum of fraction T5 from RP-HPLC profile of peptide digest. The ion at m/z 1,348.732 matches the expected mass of a tryptic peptide of FLA7, STDPVAVYQVNR (1,348.686 Da).

