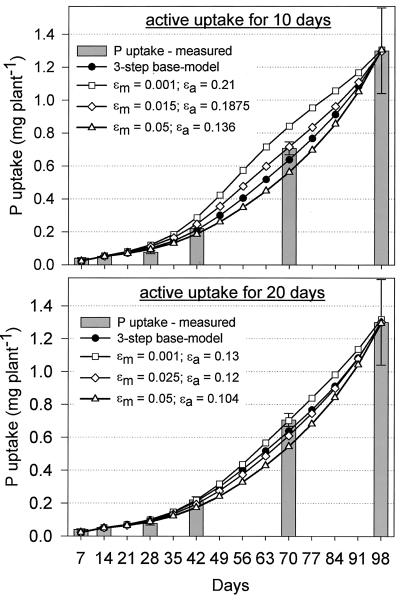
Figure 6.
Simulations of P uptake using alternative combinations for external efficiencies of active (εa) and mature (εm) roots. The duration roots remain active was varied from 10 to 20 d. Squares represent model predictions under the assumption that the contribution of mature roots to P uptake is small (εm = 0.001 μg P cm-2), and triangles show predictions if mature roots contribute much (εm = 0.05 μg P cm-2).

