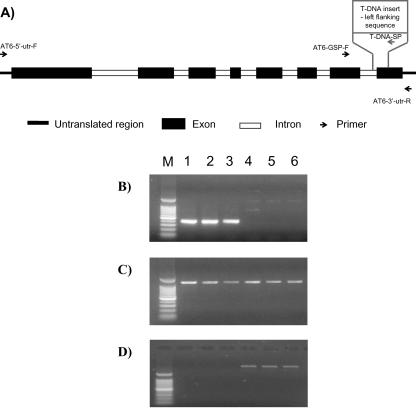
Figure 3.
A, Schematic representation of AtNDI1 showing exons, introns, primer locations (arrows indicating direction), and T-DNA insertion site. Molecular assays of the Atndi1 mutant compared with wild-type (wt) Arabidopsis. All reactions were carried out in triplicate using nucleic acid isolated from plant material from separate shaking cultures. Lanes: M, 100-bp marker; 1 to 3, Atndi1 T-DNA mutant shaking culture plants; 4 to 6, Arabidopsis wt shaking culture plants. B, Amplification products resulting from genomic PCR using AT6-GSP with T-DNA-SP. C, Amplification products resulting from RT-PCR using the AT2g29990 gene-specific primers, AT1-5′-UTR and At1-3′-UTR. D, Amplification products resulting from RT-PCR using the AtNDI1 gene-specific primers, AT6-5′-UTR and AT6-3′-UTR.

