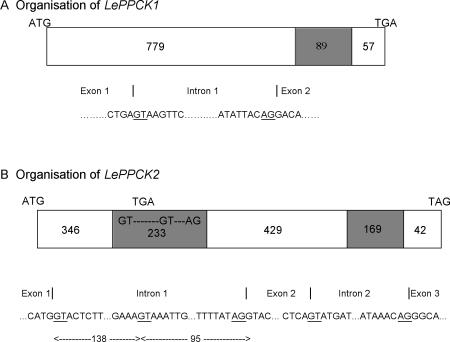
Figure 2.
Organization of the LePPCK1 and LePPCK2 genes. White boxes, Exons; shaded boxes, introns. A, LePPCK1; B, LePPCK2. The numbers show the lengths of exons and introns in base pairs. The sequences round the splice sites are shown in full; the intron start GT and end AG sequences are underlined.

