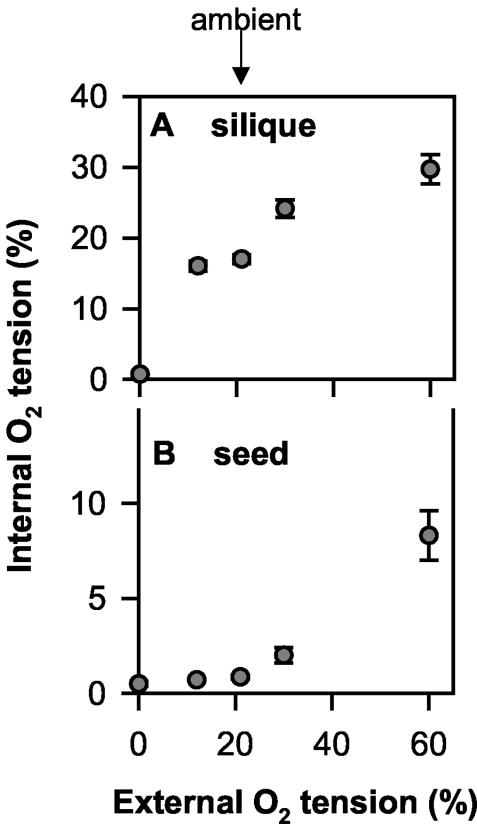
Figure 2.
Oxygen concentrations in silique space (A) and within seeds (B) and analyzed using an optical sensor (tip diameter of approximately 30 μm). In the middle of the light period, siliques (30 DAF) were exposed to circulating air containing different oxygen concentrations. The siliques were fixed in position with adhesive tape, and the internal oxygen concentration was determined by inserting the microsensor through the silique wall, either into the center of the seed or between two seeds for measuring the oxygen tension in the silique gas space. Data are means ± se of (n = 8, 4, 27, 9, and 4 for 0%, 12%, 21%, 30%, and 60% [v/v] external oxygen, respectively). Error bars are not shown when they are smaller than the symbol.

