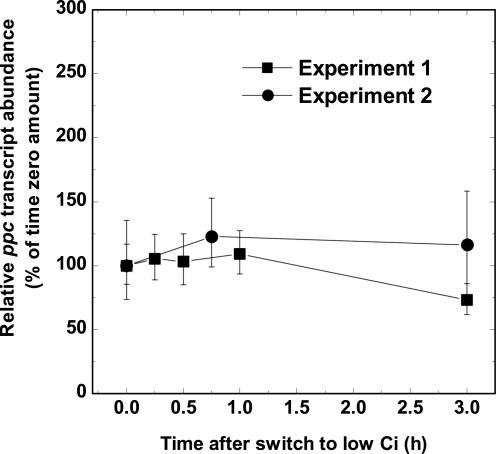
Figure 1.
Phosphoenolpyruvate carboxylase (ppc) transcript abundance in Ci-limited Synechococcus cells. Exponentially growing high-Ci cells were swapped to buffer equilibrated with CO2-free air and bubbled with CO2-free air for 3 h. The abundance of ppc transcript relative to time zero was determined by real-time PCR using cDNA pools generated from normalized, total RNA extracts from cells collected at various time points. Symbols represent the extent of induction or repression after the shift to low Ci at each time point as a percentage of the high-Ci amount (set at 100%) ± se for three separate measurements. The results of two independent experiments are shown.

