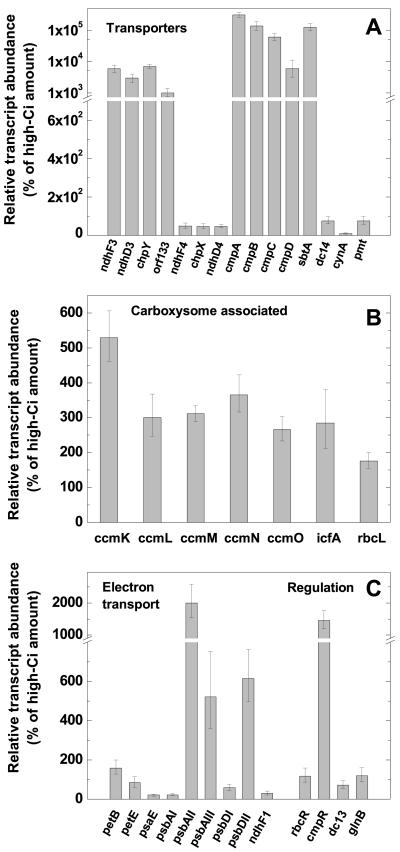
Figure 2.
Early transcriptional response of Synechococcus cells subject to a severe Ci limitation. Exponentially growing high-Ci cells were swapped to CO2-free air equilibrated buffer and bubbled with CO2-free air for 30 min. The relative abundance of specific transcripts encoding known or putative Ci transporters (A), carboxysome associated proteins (B), or electron transport or regulatory proteins (C), was determined by real-time PCR. Bars represent the extent of induction or repression after the shift to low Ci as a percentage of the high-Ci amount (set at 100%) ± se for three separate measurements. Similar data were obtained from a replicate experiment (data not shown). Note the break in the y axis in A and C. The scale is exponential after the break in A.

