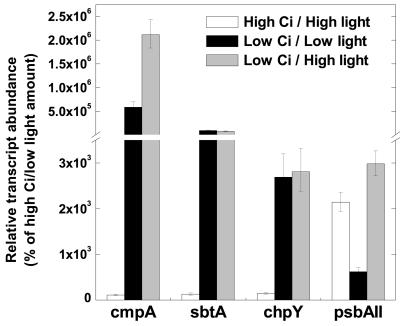
Figure 6.
Effect of light on CCM-related transcript abundance in Synechococcus cells. Exponentially growing high-Ci cells illuminated with 85 μmol photons m-2 s-1 (low light) were transferred to bubbling with CO2-free air (low Ci) and illuminated with either 85 or 500 μmol photons m-2 s-1 (high light) for 30 min. A parallel culture was illuminated with 85 μmol photons m-2 s-1 and bubbled with 1.7% CO2 as a control. The relative abundance of cmpA, sbtA, chpY, and psbAII transcripts was determined by real-time PCR. Bars represent the extent of induction or repression after the shift to low Ci as a percentage of the high-Ci/low-light amount (set at 100%) ± se for three separate measurements. Note the break in the y axis.

