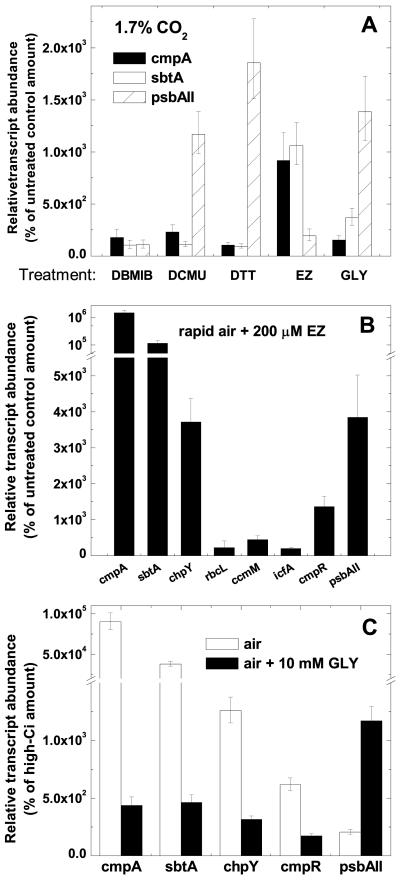
Figure 7.
Effect of redox modifiers and inhibitors of CO2 fixation or CO2 transport on CCM-related transcript abundance in Synechococcus cells. As determined by real-time PCR, bars represent the extent of induction or repression after the treatment as a percentage of the untreated control amount (set at 100%) ± se for three separate measurements. A, Relative abundance of cmpA, sbtA, and psbAII in high-Ci cells treated for 30 min with 20 μm 2,5-dibromo-3-methyl-6-isopropyl-benzoquinone, 20 μm DCMU, 5 mm DTTred, 200 μm EZ, or 10 mm GLY. B, Relative abundance of a subset of CCM-related transcripts in cells bubbled with air through a fritted sparge (rapid air; approximately 0.4 L min-1) and treated for 30 min with 200 μm EZ. y axis scale is exponential after the break. C, Relative abundance of a subset of CCM-related transcripts in high cells swapped to medium air sparging (approximately 0.15 L min-1) for 30 min in the presence or absence of 10 mm GLY. Note the break in the y axis in B and C.

